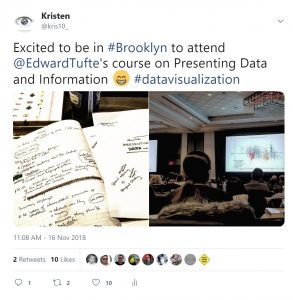
On Friday, November 16th, Kristen Treglia and Heather Hill, instructional technologists from Fordham IT’s Faculty Technology Services, attended a one-day class taught by Edward Tufte, Presenting Data and Information. Below, they offer their reflections on presenting data in general and the course itself.
 Kristen: I’ve been a fan of infographics for as long as I realized there was a name for those wonderful graphics that exploded on the web in the early 2000’s. In response to all of the interest we received around this topic, I designed a workshop on the topic and I’ve also written about Infographics in The EdTech Bible. So I was very excited to get the chance to actually meet not only one of the pioneers in the field but the “Leonardo da Vinci of data” according to NYT and as Bloomberg calls him, the “Galileo of graphics.”
 Heather: Because I have a passion for digital humanities and data visualization, getting the opportunity to learn directly from such a big name in graphics as Edward Tufte was very exciting. Tufte is perhaps best known for coining the concept of “chartjunk,” or the visual elements of charts and graphs that are unnecessary to understand the data being presented. This simple concept has informed data visualization for decades and encouraged designers to focus on the content of their data rather than distracting background details. Tufte’s research is a staple in information design courses, and his one-day workshop has offered this student much food for thought.
Takeaways
Introduction
We both liked the way Tufte began his presentation with an *animated* visualization. Project management fans will get a kick out of this, which he compared to an animated Gantt chart.
[youtube https://www.youtube.com/watch?v=OxM–mALGXc&w=560&h=315]Frédéric Chopin, Berceuse, opus 57, depicted by Stephen Malinowski’s Music Animation Machine
The greatest takeaway from Tufte’s presentation is to keep your designs straightforward, conventional, and not noisy. Content should be “rich, complicated, and luscious.” Designs should maximize content reasoning time while zeroing out format comprehension time. For instance, in the example above, you don’t have to understand how to read music to follow along; the design is simple and focuses on the content.
Data paragraphs
This concept was new to us both but made a lot of sense. A data paragraph is a minimal unit of analysis that has a coherent argument made up of words and numbers. The information in the data paragraph is “chunked” and visual, like this example below from the National Weather Service website: Each element in this visual contains a piece of vital information and is easily visible to the reader.
Sparklines
Tufte coined the term “sparklines” to describe small, high-resolution, wordlike graphics. Sparklines are typically easy to read and show a massive amount of information taken over time all at once. You may already be familiar with sparklines: medical information, like heart-rate, is often displayed as a sparkline.
 Sparklines are great at revealing larger trends, especially since they reveal large samplings of information at once. They also guard against cherry-picked data, which Tufte cautions to avoid.
Fundamental Principles of Analytical Thinking
 “Napoleon’s March to Moscow” is one of the most famous infographics of all time. It is frequently used as an ideal example of data visualization because there’s no chartjunk and it clearly breaks down complex information into these fundamental principles:
- Comparisons
- Causality, Mechanism, Structure, Explanation
- Multivariate Analysis
- Integrity of Evidence
- Documentation
- Content Counts Most of All
A couple surprises
Overall we learned a lot and it was great to spend a day thinking and learning about infographics. A couple of things surprised us.
Throughout the day he reiterated his advice against using slides during presentations. While it’s true one should not read their slides, we believe that slides are a useful way to visually reinforce your message. Slides can also be shared with audiences after a presentation and made accessible for screen readers. See Designing Effective Presentations via the Fordham EdTech Resource
We also didn’t appreciate the multiple “study” sessions throughout the course. This implies that all of the audience members can read and comprehend the materials at the same rate. Such a strategy marginalizes different groups of learners and frustrates people who prefer to read on their own time and favor group conversation and activity. See Flipped Classroom
Finally, we were surprised that the class wasn’t more academically focused. Most of the afternoon was narrowly focused on doctors and the field of medicine. Tufte had quite a few anecdotal experiences to share with us that did not enrich our understanding of the material.
Conclusion
Tufte offered several new insights into presenting data to a variety of audiences. This was a valuable experience, and we look forward to applying the many concepts he covered to our future work.
Resources
Edward Tufte is a statistician and artist, and Professor Emeritus of Political Science, Statistics, and Computer Science at Yale University.
- Edward Tufte’s website and about his course
- FTC Techshop: Infographics
- Heather’s website
- Kristen’s website and The EdTech Bible
About the Authors
Kristen Treglia, Senior Instructional Technologist
Since 2008, Kristen has given Fordham faculty engaging support, advice and training based on her deep understanding of digital pedagogical methods and their potential to improve learning outcomes. A strong belief in collaboration and sharing resources has led Kristen to develop wide-ranging resources focused on teaching best practices that use technology-based educational methods and materials, including over 100 online slide decks that have garnered more than a half a million views.
Kristen’s broad experience helps faculty develop interactive lessons and activities both in the face-to-face format, as well as online. She is an experienced Blackboard administrator and is part of the distance learning team that designs and creates online courses at Fordham. Kristen is also well-versed in filmmaking including producing, directing, filming and editing video. She draws from this extensive experience to help faculty to create flipped classes.
Kristen is the author of The EdTech Bible, a multimedia ebook that shares her expertise with those new to the classroom, as well as experienced teachers looking for new ideas. The EdTech Bible is available on Amazon and iBooks. Kristen’s website contains a variety of resources she has created or curated.
Prior to working at Fordham, Kristen taught high school math for ten years. She also holds a bachelor’s degree from the University of Texas at Austin.
Heather Hill, Instructional Technologist
Since joining the ITAC team in the fall of 2018, Heather has supported faculty and instructors through the creation and development of digital projects in the Academic Computer Environment (ACE). She also serves as a liaison to graduate students and designs resources to support their digital research and teaching. Heather is especially passionate about digital humanities (DH), accessibility, and user experience (UX), and is excited to help the Fordham community implement these ideas in their work.
Heather has a background in Medieval Studies (M.A., Fordham University) and Library & Information Science (M.S.L.I.S., Pratt Institute). She has had broad training in digital humanities tools, including mapping platforms, text analysis, photo analysis, and information visualization, and has conducted methodological research regarding the history of digital humanities. Heather also developed digital library learning objects as an Instructional Design Intern at the New York City College of Technology (City Tech) and conducted user tests for clients engaged in academic librarianship and archival work.
Heather is eager to share her knowledge and experience with the community.


